The Sweo Performance dashboard brings together Sweo’s core support metrics—automation rate, resolution rate, involvement rate, and CX Score—in one place. It’s built to help teams monitor Sweo’s performance, catch issues early, and clearly communicate impact across the business.
Track resolution, handoffs, and customer sentiment in one view: See how often Sweo fully resolves issues, where it escalates, and how customers feel about the experience.
Know when Sweo works—and when to step in: Understand Sweo’s level of involvement and when escalations happen, so you can adjust support workflows or improve Sweo's training.
Measure efficiency and experience together: Monitor both speed and quality by combining resolution rates with CX Scores—so you can balance cost and care.
Share performance data with clarity and confidence: Use clean, easy-to-read metrics to communicate Sweo’s impact to leadership or guide ongoing improvements with your team.
Access the Sweo performance dashboard
To view the Sweo Performance dashboard, go to Analyze > Performance.

Note: You’ll only see the Performance dashboard once you’ve set Sweo live and it’s involved in conversations.
How to use the Sweo Performance dashboard
Get a quick glance at Sweo's KPIs
The charts at the top of the Sweo Performance dashboard give you a quick overview of Sweo’s KPIs: involvement rate; resolution rate; and CX Score, for the time period you’ve selected.
Automation rate: Percentage of conversations resolved by Sweo out of all new conversations. This reflects how much of your total support volume Sweo is handling successfully.
Involvement rate: The percentage of conversations that were passed to Sweo AI Agent (out of all new conversations). This metric reflects Sweo's coverage—how much of your total conversation volume Sweo is actively handling and attempting to resolve.
Resolution rate: The percentage of conversations that Sweo successfully resolves without needing to escalate to a human. This metric reflects Sweo’s effectiveness in fully resolving customer issues. A high resolution rate means Sweo is reducing team workload while maintaining service quality.
See Sweo’s CX Score
This is the percentage of positive customer ratings out of all ratings received for conversations handled exclusively by Sweo, without any human agent involvement. It’s split into positive and negative CX Score reasons and how they’re distributed across:
Product feedback
Sweo answer quality
User emotion
Policy feedback
User effort
Review Sweo's performance funnel
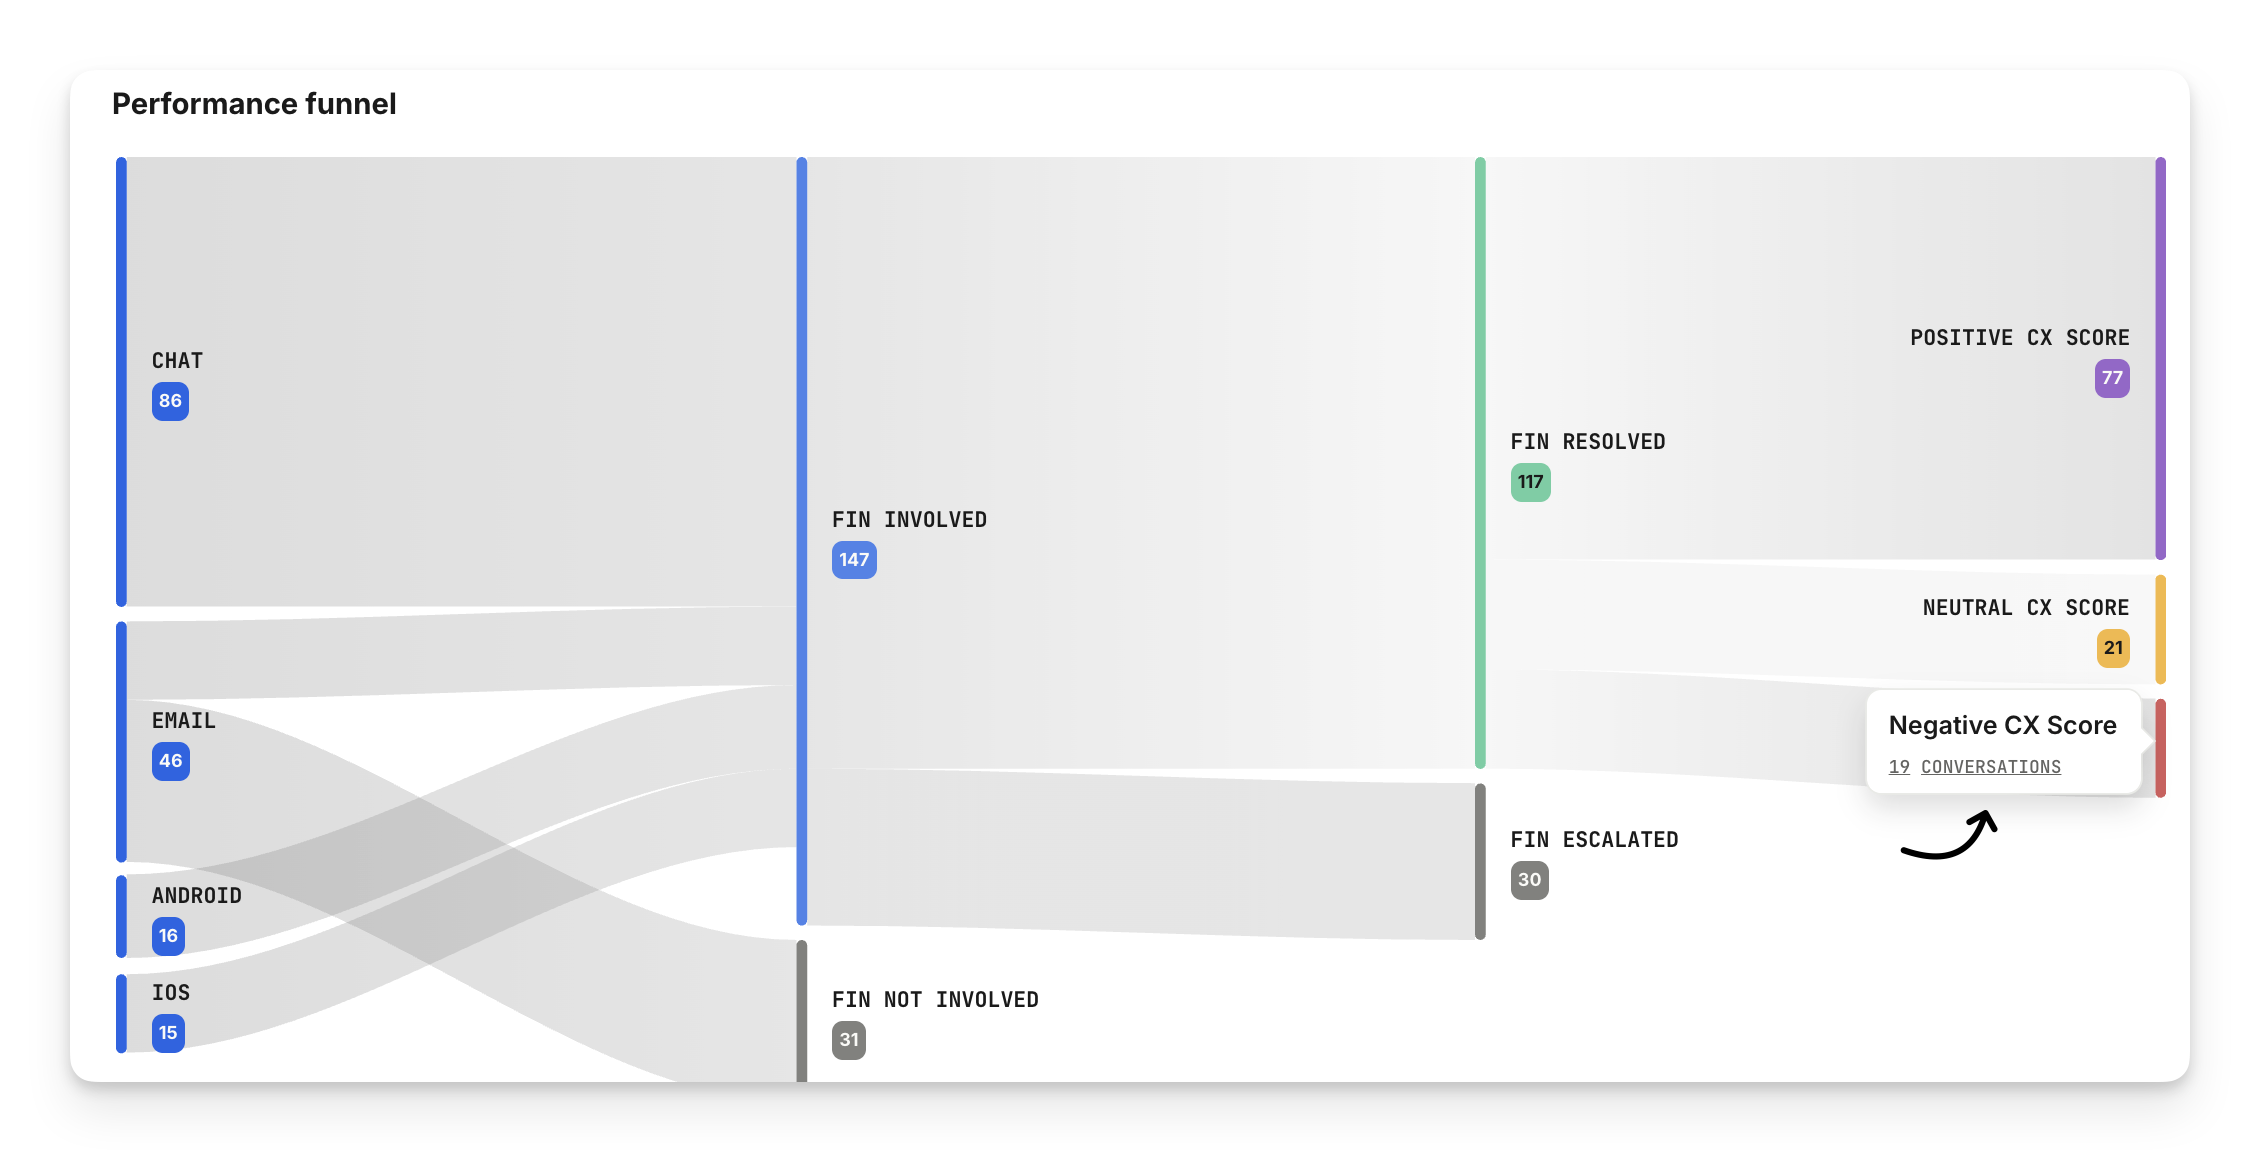
The Performance funnel visualizes how conversations flow through key stages when Sweo is involved. It allows you to quickly understand Sweo's coverage across channels, success at resolving queries, and the customer experience—all in a single, digestible view.

Sweo Performance funnel structure
Total conversations by channel
Displays the total number of new conversations received across all channels (e.g. Chat, Messaging, Tickets, Cases).
Provides a baseline for understanding volume distribution by channel.
Sweo involvement
Splits total conversations into:
Sweo involved: Conversations where Sweo was involved.
Sweo not involved: Conversations that were routed straight to teammates.
Helps assess total conversation coverage and identify gaps in Sweo deployment for each channel and across all channels.
Outcomes of Sweo-involved conversations
Categorizes the result of conversations Sweo was involved with:
Sweo resolved: Handled and resolved entirely by Sweo, no human agent involved (confirmed and assumed resolutions).
Procedure handoff: The number of conversations in which the Sweo Procedure or Sweo Task intentionally handed the conversation to a team or another workflow.
Sweo escalated: Escalated from Sweo to a teammate.
Broken down into User requested vs Rules & guidance, so you can see how much handoff volume is driven by configuration.
Pending: Still in progress (for example, waiting for the customer to respond).
Enables tracking of how effective Sweo is at handling customer conversations for the entire conversation volume.
CX Score
Shows a breakdown of CX ratings for the conversations resolved solely by Sweo:
Positive CX Score: Ratings with a 4 or 5
Neutral CX Score: Ratings with a 3
Negative CX Score : Ratings with a 1 or 2
See how satisfied customers were with their experience when dealing directly with Sweo.
Hover over each path and click on Conversations to see where to adjust workflows for better involvement, or improve Sweo’s training for better resolutions and customer experience.
Tip: For a closer analysis of where Sweo is underperforming, head to the Optimize dashboard to see what needs fixing, why it matters, and how to improve it.
Track Sweo's performance over time
The multi-metric line chart shows you these same metrics over time. You can see both the absolute number of conversations, and their rates using the toggle at the top of the chart.
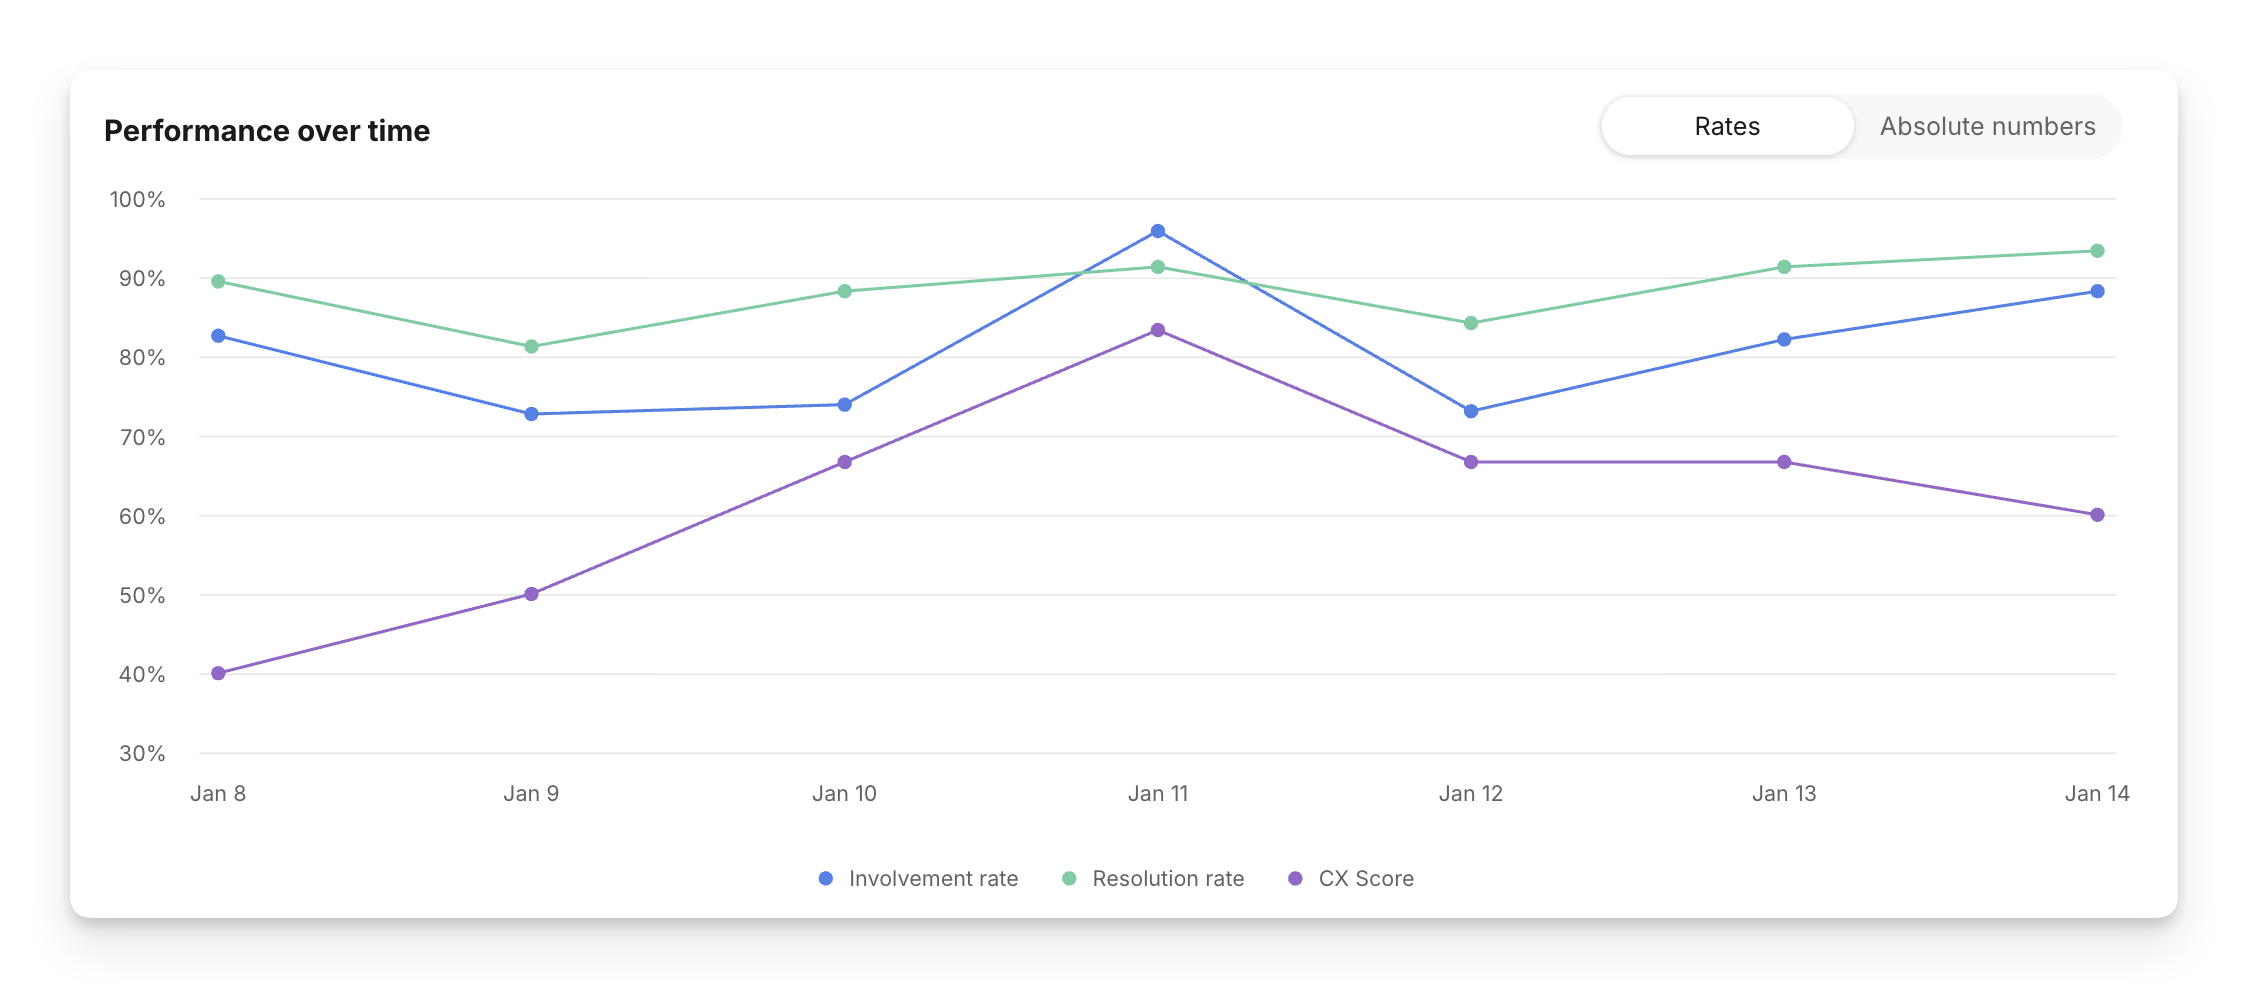
Tip: If you notice a drop in Sweo's performance, head to the Optimize dashboard to see what needs fixing, why it matters, and how to improve it.
FAQs
Where has the deflection rate gone?
Where has the deflection rate gone?
Sweo’s deflection rate is still available in the Custom Report section of the product. The Performance dashboard focuses on the KPIs that are most important for Sweo. If resolution rate is improved, so will deflection.
Why is the positive ratings number in the CX Score chart different from the sankey chart in the Sweo Performance dashboard?
Why is the positive ratings number in the CX Score chart different from the sankey chart in the Sweo Performance dashboard?
The two charts are measuring different things:
CX Score chart: This shows the positive ratings for all conversations where Sweo was the primary agent, regardless of the outcome. This includes conversations that were not fully resolved, such as those that are currently pending or escalated.
Sankey chart in Sweo Performance dashboard: This is filtered to only include conversations where Sweo was involved and the conversation reached a resolution (either assumed or confirmed).
As a result, the set of conversations — and therefore the rating counts — will differ between the two charts.